Thursday, July 10, 2008
Acarbose Improves Glycemic Control in Overweight Type 2 Diabetic
Acarbose Improves Glycemic Control in Overweight Type 2 Diabetic
from Diabetes Care
Results
A total of 83 patients were randomized to the two treatment arms. Of those, 2 patients were excluded from the ITT analysis for HbA1c (acarbose n = 38, placebo n = 43) and 1 patient had no baseline fasting blood glucose data and was thus excluded from the ITT analysis for FBG (acarbose n = 39, placebo n = 43). In the PP population, 71 patients were included for HbA1c analysis (acarbose n = 33, placebo n = 38) and 74 for FBG analysis (acarbose n = 35, placebo n = 39). All randomized patients were included in the safety analysis (acarbose n = 40, placebo n = 43). Baseline demographic data and efficacy variables of all randomized subjects compared well between the treatment groups (Table 1). Both treatment groups received the same median dosage of metformin (1,700 mg/day).
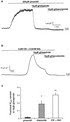
Figure 1A shows the change in mean HbA1c levels during the study course (ITT analysis). Significant differences between the treatment groups compared to baseline were seen for weeks 12 and 24 (P = 0.0009 and P = 0.0023, respectively). Mean HbA1c levels increased in the placebo group from 7.82 ± 0.83% at baseline to 8.1 ± 1.06% at week 12 and 8.5 ± 1.44% at study end. The mean increase after 24 weeks was 0.68 ± 1.17%, with a significant overall time effect (P = 0.0001). In the acarbose group, levels decreased from 8.02 ± 0.85% at baseline to 7.78 ± 1.0% at week 12 (P = 0.0261). Levels then increased to 7.97 ± 1.1% at study end (mean change after 24 weeks was -0.05 ± 0.8%). There was no significant overall time effect for acarbose. The adjusted least square means for the change in HbA1c from baseline to week 24 showed a reduction of 0.16 ± 0.18% in the acarbose arm compared to an increase of 0.86 ± 0.16% in the placebo group, with a statistically significant difference between the treatment arms of 1.02% (95% CI 0.543-1.497, P = 0.0001). There was a significantly greater proportion of responders in the acarbose group (n = 18; 47%) than in the placebo group (n = 6; 14%) (P = 0.001) at the end of the study.
Figure 1. (click image to zoom) Change in mean HbA1c (A) and mean FBG (B) during a 24-week treatment period with acarbose (•) or placebo () adjunctive therapy in the ITT population.
Mean levels of the secondary efficacy variable FBG increased in the placebo arm from baseline (9.41 ± 1.99 mmol/l) to week 4 (10.06 ± 2.43 mmol/l) and continued to increase to the end of study (10.77 ± 3.39 mmol/l), whereas levels in the acarbose arm varied only slightly from baseline (Fig. 1B). The mean increase was 1.36 ± 2.88 mmol/l for the placebo and 0.08 ± 1.98 mmol/l for the acarbose group. The adjusted least square means showed an increase at end point in both groups: 0.34 ± 0.42 mmol/l for acarbose compared to 1.48 ± 0.39 mmol/l for placebo patients, with a statistically significant difference of 1.132 mmol/l between the two groups (95% CI 0.056-2.208, P = 0.0395). PP analyses for both variables showed similar results, but were not statistically significant for treatment differences concerning FBG.
Of the 83 patients valid for safety analysis, 76 completed the study. Mean study duration was 169 days for both acarbose (29-184 days) and placebo (39-176 days). Overall compliance (80-120% compliance) was 100% for acarbose and 95.3% for placebo patients. In all, five patients reduced the medication dose to 50 mg b.i.d. because of adverse events (acarbose, n = 3; placebo, n = 2); three of these patients later reverted back to the original dosage. Patients in both treatment groups experienced a small mean weight reduction over the study period (1.32 ± 2.37 kg for acarbose vs. 0.43 ± 2.9 kg for placebo patients), which was not significantly different (P = 0.13). There were also no significant changes in vital signs. Changes in routine laboratory parameters were similar in both treatment groups, except for one patient (acarbose group) with elevated liver function enzymes who was withdrawn from the study. In total, seven patients were prematurely withdrawn from the study during the 24-week treatment period: four because of treatment-emergent adverse events, one patient on placebo because of constipation and depression, and three patients on acarbose with flatulence, flatulence accompanied by abdominal pain, and the aforementioned elevated liver enzymes. A serious adverse event with remote or no relation to the study medication was experienced by two acarbose patients and one placebo patient; no fatalities occurred. Treatment-emergent adverse events with a relation to the study medication rated as "possible" or "probable" were reported by 75% of acarbose and 55.8% of placebo patients. The main difference between the treatment groups was the higher frequency of gastrointestinal complaints in the acarbose group (Table 2).
This is a part of article Acarbose Improves Glycemic Control in Overweight Type 2 Diabetic Taken from "Generic Amaryl (Glimepiride) Information" Information Blog
Labels: pharmacology
![]()